A Better Umami Dashboard with Grafana
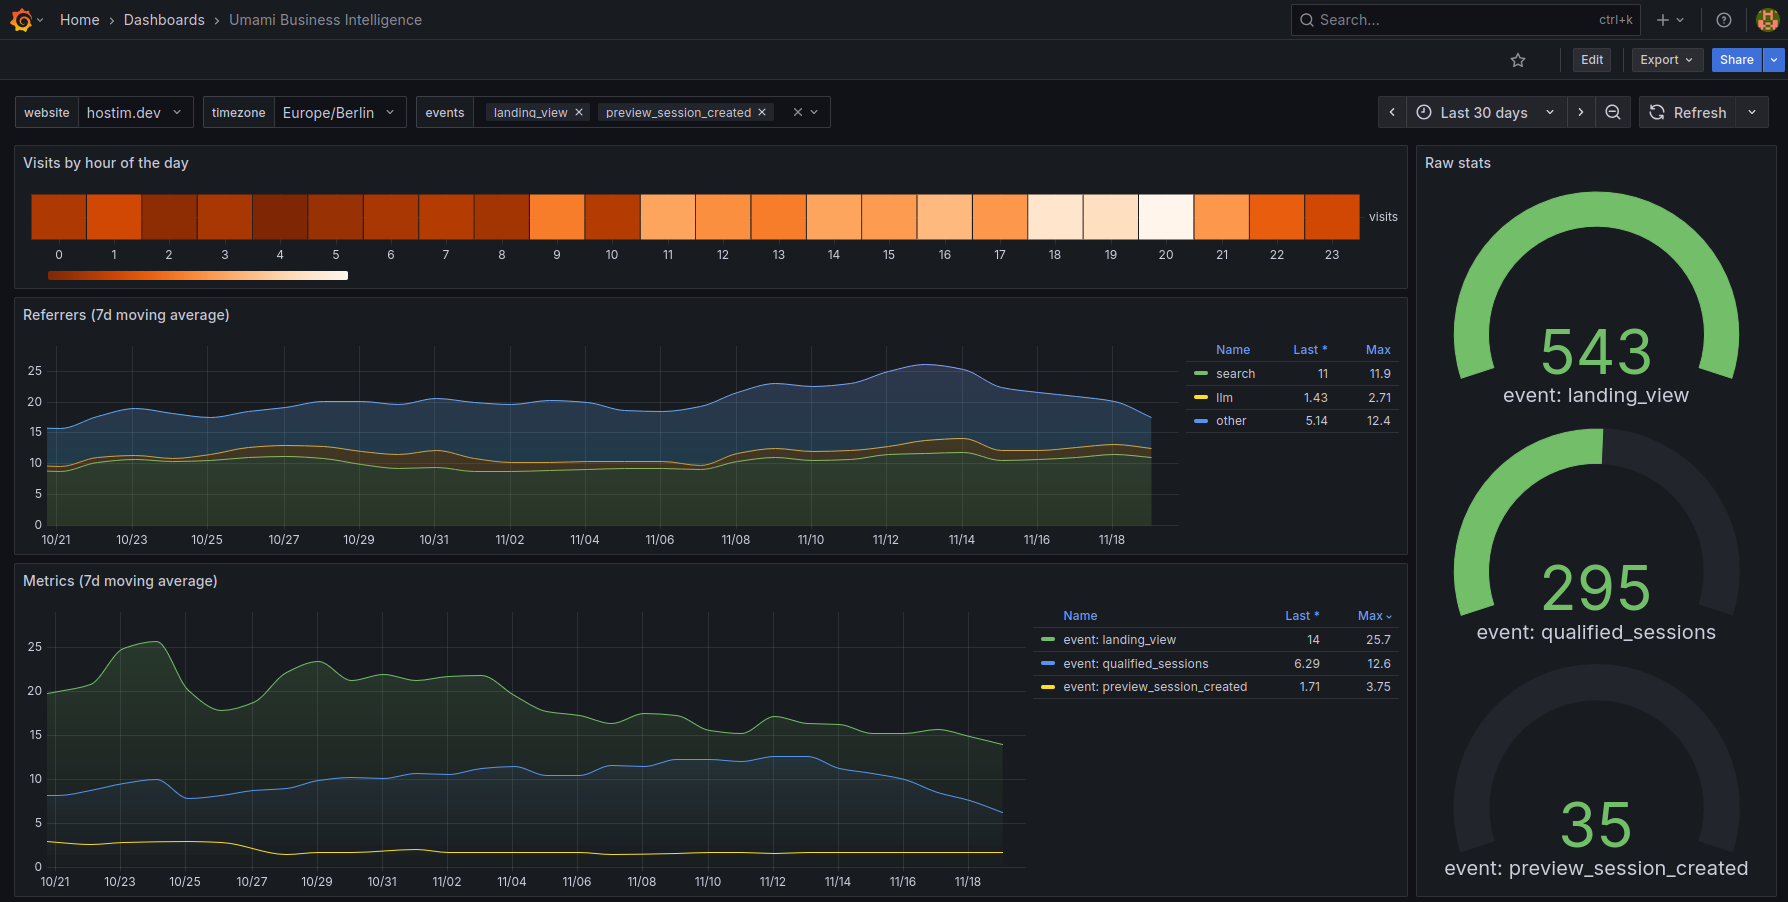
Umami is great. Lightweight, privacy-friendly, no cookies, no tracking drama. We use it ourselves on Hostim.dev, and we ship a one-click Umami template for anyone who wants simple, privacy-focused analytics.
But once you start relying on analytics to make actual decisions, you hit the limits pretty quickly.
Why the default Umami dashboard wasn't enough
Umami intentionally keeps things minimal, but some gaps become obvious:
- No clear view of when visitors peak during the day
- Hard to isolate bots from real traffic
- No moving averages or trend smoothing
- No grouped referrers (e.g. "search", "LLM", "other")
- Limited visibility into relationships between sessions and custom events
None of this is criticism – Umami is intentionally simple. But sometimes you want more resolution.
So I took the quickest path:
Deploy Grafana → connect it to Umami's PostgreSQL → build a custom dashboard.
This took maybe ten minutes and unlocked:
- Daily heatmap showing real traffic peaks
- 7-day moving averages for referrers
- Qualified sessions (≥2 pageviews) to filter out most bots
- Selectable custom events
- Raw stats for the selected period
Suddenly Umami became "actionable" instead of just "nice".
How to connect Grafana to Umami's PostgreSQL
Inside Grafana:
Configuration → Data sources → Add data source → PostgreSQL
Fill in the credentials from your Umami database and save.
You can now import our dashboard:
Try it yourself
If you prefer to self-host on your own VPS, here is a complete Docker Compose stack for Umami, PostgreSQL, and Grafana.
Full Docker Compose stack
services:
  postgres:
    image: postgres:15
    restart: always
    environment:
      POSTGRES_USER: umami
      POSTGRES_PASSWORD: umami_pass
      POSTGRES_DB: umami
    volumes:
      - postgres_data:/var/lib/postgresql/data

  umami:
    image: ghcr.io/umami-software/umami:postgres-latest
    restart: always
    depends_on:
      - postgres
    environment:
      DATABASE_URL: postgres://umami:umami_pass@postgres:5432/umami
      DATABASE_TYPE: postgresql
      APP_SECRET: "replace_this_with_a_random_secret"
    ports:
      - "127.0.0.1:3000:3000"

  grafana:
    image: grafana/grafana:latest
    restart: always
    depends_on:
      - postgres
    environment: GF_SERVER_DOMAIN=grafana.example.com
      GF_SERVER_ROOT_URL=https://grafana.example.com
    ports:
      - "127.0.0.1:3001:3000"
    volumes:
      - grafana_data:/var/lib/grafana

volumes:
  postgres_data:
  grafana_data:
Start everything:
docker compose up -d
Then:
- Umami → http://localhost:3000
- Grafana → http://localhost:3001
In Grafana, configure a PostgreSQL data source:
Host: postgres
Port: 5432
User: umami
Password: umami_pass
Database: umami
Import the dashboard using the ID from Grafana.com.
Don't want to run a server?
If you don't want to manage Docker, OS maintenance, or networking, you can deploy the same stack on Hostim.dev by simply pasting the Compose file above when creating a new project.
- Choose Paste Docker Compose
- Use the YAML from this section
Hostim.dev will handle HTTPS, internal networking, logs, metrics, and persistence for all three services.
👉 Try Hostim.dev – deploy the full stack without touching SSH
Already running Umami on Hostim.dev?
If you deployed Umami using the one-click template, you don't need a new project. Just:
- Create a separate Grafana App in the same project
- Use the
grafana/grafana:latestimage - Add the existing Umami PostgreSQL as a Grafana data source
- Import the dashboard JSON
Both apps run on the same private project network, so they can communicate without exposing ports or adjusting firewall rules.